The Render Pipeline
Deep dive into each stage of the browser rendering pipeline, covering what runs on main vs compositor thread and what makes each step slow.
In the layout thrashing post we skimmed the five stages of a frame. This one goes deeper: what each stage actually does, what runs on the main thread vs the compositor, and, most importantly, what makes each step slow.
The full pipeline
Every frame the browser produces follows this sequence:
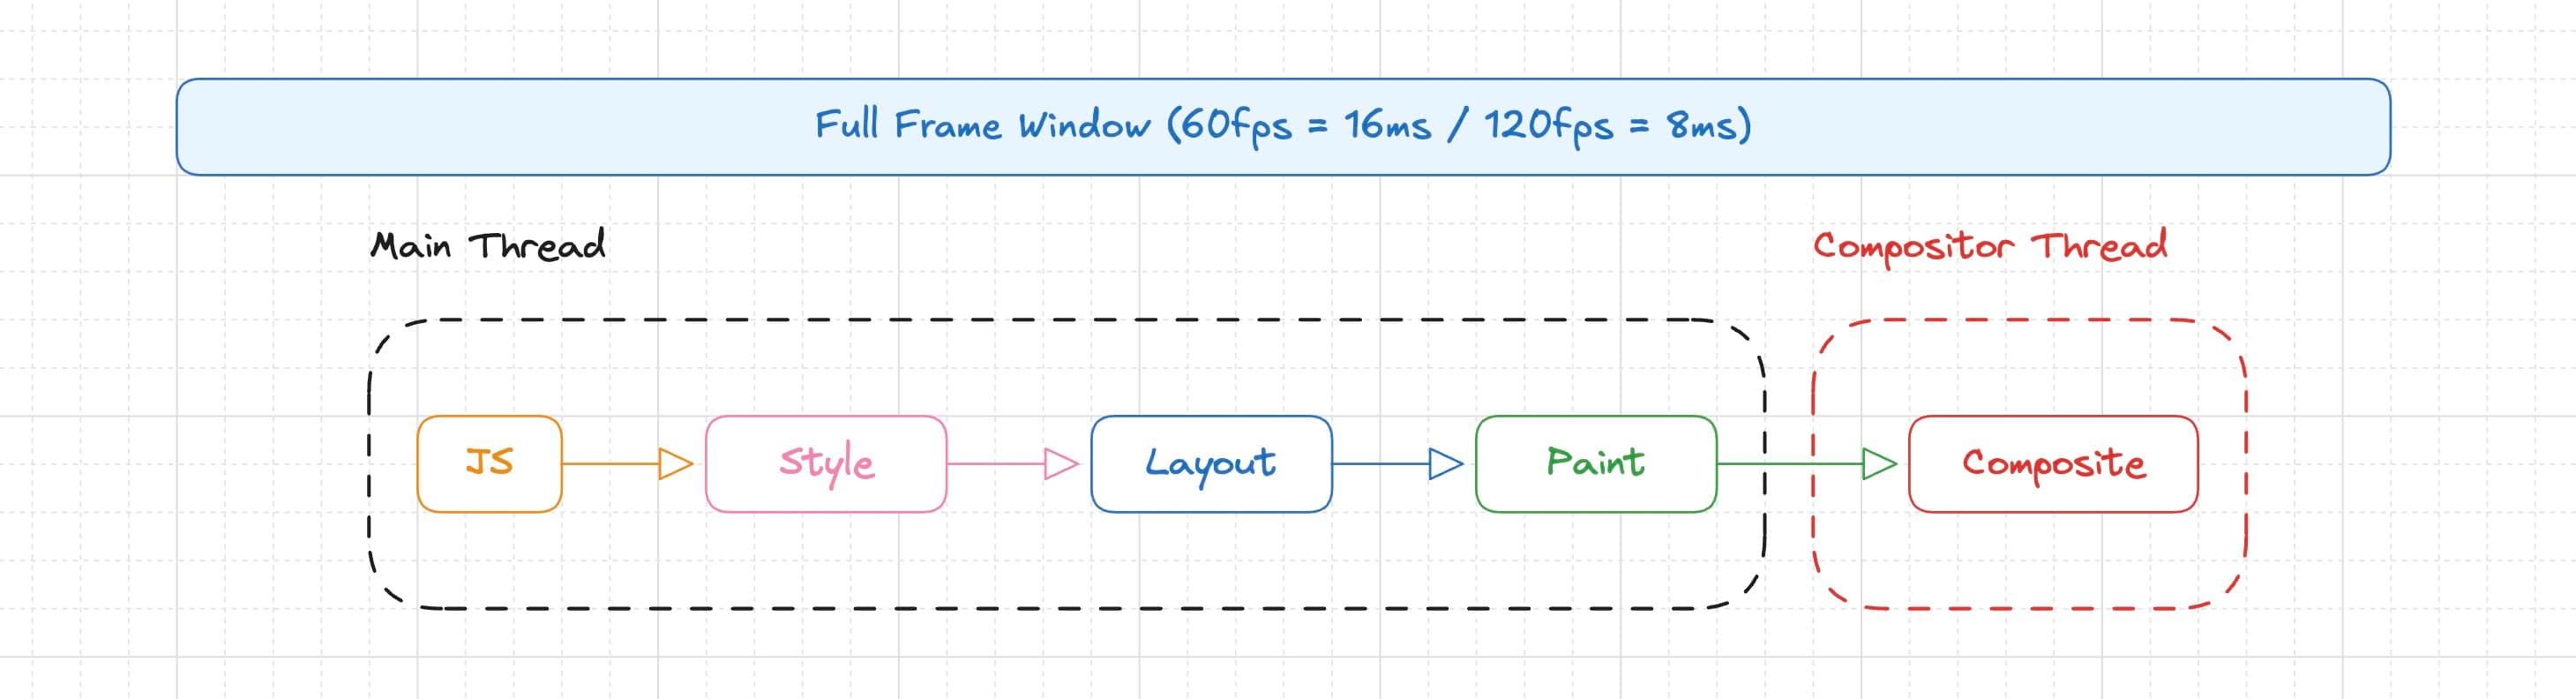
The first four run on the main thread (the same thread your JS runs on). The last one, Composite, runs on the compositor thread, a separate thread on the GPU side. This distinction is the single most important thing to internalize: anything on the main thread competes with your JS for render time. Anything on the compositor thread is cheap, not free. Layer explosion, implicit promotion, and backdrop-filter re-sampling can all make compositing expensive (more on that in Composite).
1. JavaScript
This is where your code runs. Event handlers, requestAnimationFrame callbacks, setTimeout/setInterval, framework reconciliation (React commits), GSAP tweens, IntersectionObserver callbacks, ResizeObserver callbacks, all of it.
The browser gives you ~16.6ms per frame at 60fps. Your JS budget is a slice of that, because the browser still needs time for the remaining steps.
What makes it slow
Long tasks. Any JS execution that blocks the main thread for >50ms is a "long task". While your JS runs, the browser cannot run Style, Layout, Paint, or respond to user input. Common culprits:
// Parsing and mounting a huge component tree synchronously
root.render(<MassiveApp />) // can block for 100ms+ on slow devices

// Synchronous array operations on large datasets
const sorted = items.sort((a, b) => expensiveComparison(a, b))

// JSON parsing large payloads
const data = JSON.parse(hugeString) // blocks until done
Forced reflows (covered in depth in the layout thrashing post). Every forced reflow pulls Layout work into your JS execution time:
for (const el of elements) {
  el.style.width = `${newWidth}px`     // write → invalidates layout
  const h = el.offsetHeight            // read → forces synchronous layout
}
// 100 elements = 100 full layout computations during JS, not 1
Garbage collection pauses. Creating tons of short-lived objects (like allocating new arrays/objects every frame in an animation loop) triggers GC pauses you can't control:
// BAD: allocating new objects every frame
function animate() {
  const pos = { x: lerp(a, b, t), y: lerp(c, d, t) } // new object every frame
  element.style.transform = `translate(${pos.x}px, ${pos.y}px)`
  requestAnimationFrame(animate)
}

// GOOD: reuse the object
const pos = { x: 0, y: 0 }
function animate() {
  pos.x = lerp(a, b, t)
  pos.y = lerp(c, d, t)
  element.style.transform = `translate(${pos.x}px, ${pos.y}px)`
  requestAnimationFrame(animate)
}
Pain point summary
| Symptom | Cause | Fix |
|---|---|---|
| Input feels laggy | Long task blocking main thread | Break work into chunks, use scheduler.yield() or requestIdleCallback |
| Animation jank on first frame | Expensive mount/hydration | Defer non-critical work, lazy load |
| Random frame drops | GC pauses | Reduce allocations in hot paths, reuse objects |
| Consistent frame drops in loops | Forced reflows | Batch reads before writes (see post 11) |
2. Style (Recalculate Style)
After JS finishes, the browser resolves every CSS rule that applies to every affected element. Selector matching, cascade resolution, specificity, inheritance, all of that produces a final computed style for each element.
This step answers: "given all the stylesheets, classes, inline styles, and inherited values, what is the resolved value of every CSS property for every element?"
What makes it slow
Selector complexity × element count. The browser has to match selectors against elements. Simple selectors (.class, #id, [data-attr]) are fast. Complex selectors that force the browser to walk up the DOM tree are slower:
/* Fast, direct class match */
.card-title { color: red; }

/* Slower, the browser has to check ancestors */
.sidebar > .card-list > .card > .card-title { color: red; }

/* Slowest, :has() forces downward + upward lookups */
.card:has(.card-title:hover) { outline: 1px solid blue; }
In practice, selector speed rarely matters unless you have thousands of elements being restyled at once. The real killer is:
Invalidation scope. When you change a class or style, the browser has to figure out which elements are affected. Some changes invalidate a lot:
// Changes body class → every element in the document might be affected
document.body.classList.toggle('dark-mode')
// The browser has to re-resolve styles for potentially the ENTIRE tree

// vs. scoped change → only this subtree is invalidated
card.classList.toggle('expanded')
CSS custom properties (variables) that cascade widely. Changing a variable on :root invalidates every element that inherits or uses it:
// This can trigger style recalculation for the entire page
document.documentElement.style.setProperty('--accent', '#ff0000')
Pain point summary
| Symptom | Cause | Fix |
|---|---|---|
| Long "Recalculate Style" in DevTools | Too many elements restyled at once | Scope changes to subtrees, avoid body-level class toggles during animations |
| Style recalc on every frame | Animating CSS classes instead of transforms | Use transform and opacity, they skip Style entirely on subsequent frames |
3. Layout (Reflow)
With computed styles in hand, the browser calculates the geometry of every element: position, size, and how elements relate to each other in the document flow. This is where the box model, flexbox, grid, floats, and absolute/relative positioning all get resolved.
Layout is inherently global, changing one element's size can push siblings, resize parents, and cascade through the entire document.
What makes it slow
Layout scope. Most layout changes affect more elements than you think:
// Changing this element's height can trigger layout for:
// - Its parent (needs to resize)
// - Its siblings (need to reposition)
// - Its parent's parent (needs to resize)
// - Elements further down that depend on this subtree's size
element.style.height = '200px'
Expensive layout modes. Not all layout is equal:
/* Tables are expensive, the browser often needs two passes
   (one to measure content, one to distribute widths) */
display: table;

/* Deep flex nesting multiplies layout cost */
.flex-container > .flex-container > .flex-container > .flex-item {
  flex: 1; /* each level has to negotiate sizes with its children */
}

/* Grid with auto-sizing tracks forces content measurement */
grid-template-columns: repeat(auto-fill, minmax(200px, 1fr));
contain: layout can help. It tells the browser that this element's internals don't affect outside layout, so the browser can skip re-laying-out ancestors:
.isolated-widget {
  contain: layout;
  /* now changes inside this element won't trigger layout
     recalculation for elements outside it */
}
Text and intrinsic sizing. Any time the browser has to measure text to determine element size (width: max-content, width: fit-content, or just a <p> in a flex container), it needs to run the text shaping engine. This is significantly more expensive than sizing elements with explicit dimensions.
Pain point summary
| Symptom | Cause | Fix |
|---|---|---|
| Layout events >5ms in DevTools | Large layout scope / deep DOM | Use contain: layout or content-visibility: auto to isolate subtrees |
| Jank when resizing | Flex/grid renegotiating sizes | Use explicit dimensions where possible, avoid deeply nested flex |
| Slow list rendering | Thousands of elements in flow | Virtualize with fixed-height rows to minimize layout scope |
| Layout during animation | Animating width, height, top, left | Animate transform instead, it skips Layout entirely |
4. Paint
Paint happens in two phases:
- Paint recording (main thread): the browser walks the render tree and records draw commands into a display list, "draw this background", "draw this border", "draw this text", "draw this image". Think of it as generating instructions, not actually drawing pixels.
- Rasterization (GPU/raster threads): the display lists get turned into actual pixels in textures. This happens off the main thread on raster worker threads, so it usually doesn't block your JS.
Each element that creates a new stacking context or that the browser decides to promote gets its own layer. More layers means more memory but potentially less repaint area.
What makes it slow
Large paint areas. If a non-composited element changes appearance, the browser has to repaint the entire area of its layer:
/* A full-screen background color change repaints the entire viewport */
body { background: var(--bg); }
/* Changing --bg repaints everything on that layer */

/* A box-shadow change on a large element is expensive to paint */
.hero {
  width: 100vw;
  height: 100vh;
  box-shadow: 0 0 80px rgba(0,0,0,0.5); /* complex to rasterize */
}
Expensive paint operations. Some CSS properties are much more expensive to paint than others:
/* Cheap to paint */
background-color: red;
border: 1px solid black;

/* Moderate */
border-radius: 8px;  /* needs anti-aliased curves */
background: linear-gradient(to right, red, blue);

/* Expensive */
box-shadow: 0 4px 20px rgba(0,0,0,0.3);  /* blur is costly */
filter: blur(10px);     /* per-pixel operation (when not composited) */
clip-path: polygon(...); /* complex geometry clipping */
-webkit-text-stroke: 1px black; /* text re-rendering */
Layer explosion. Too many layers waste GPU memory and increase compositing overhead:
/* Each of these creates a new layer, 1000 items = 1000 layers */
.list-item {
  will-change: transform; /* don't do this to every element */
}
will-change misuse. will-change promotes an element to its own layer, which means its paint is isolated (good) but it consumes GPU memory (bad if overused):
/* GOOD: promote only elements that actually animate */
.animating-card { will-change: transform; }

/* BAD: promoting everything "just in case" */
* { will-change: transform, opacity; } /* GPU memory bomb */
Painting off-screen layers. The browser tries to cull layers that are completely outside the viewport, if a layer isn't visible, it skips painting it entirely. But several things can break this optimization and force the browser to paint layers you can't even see:
-
overflow: visible(the default). If a parent hasoverflow: visible, the browser can't guarantee its children are clipped to any boundary, so it has to paint them even if they're positioned off-screen. They might have content that bleeds into the viewport. -
Large or unbounded layers. If an element's layer is very large (e.g., a
position: absoluteelement with a huge width/height, or a canvas element sized way beyond the viewport), the browser has to rasterize the full layer even if only a sliver is visible. Rasterization cost scales with the layer's pixel area, not what's on screen. -
will-changeon off-screen elements. Promoted layers stay in GPU memory and get composited even when off-screen. If you promote 200 list items but only 10 are visible, you're paying for 200 layers.
/* The browser can cull this: content is clipped to the container */
.scroll-container {
  overflow: hidden; /* or auto/scroll */
  contain: paint;   /* explicitly tells the browser nothing paints outside */
}

/* The browser CANNOT cull children here: they might overflow into view */
.container {
  overflow: visible; /* default, no clip boundary */
}
content-visibility: auto is the strongest hint you can give. It tells the browser to skip all rendering work (style, layout, paint) for elements that are off-screen, and the browser automatically starts rendering them as they approach the viewport:
.card {
  content-visibility: auto;
  contain-intrinsic-size: 0 300px; /* placeholder height so scroll doesn't jump */
}
This is especially effective for long pages with many sections or cards: the browser only pays the paint (and layout) cost for what's actually near the viewport.
contain: paint is lighter; it doesn't skip layout, but it tells the browser that nothing inside this element paints outside its bounds, which lets the compositor cull the layer when it scrolls out of view:
.widget {
  contain: paint;
  /* browser now knows: if this box is off-screen, nothing inside it is visible */
}
Pain point summary
| Symptom | Cause | Fix |
|---|---|---|
| Long "Paint" in DevTools | Large repaint area or expensive properties | Promote animating elements to their own layer with will-change |
| High GPU memory usage | Too many layers | Audit layers in DevTools (Layers panel), remove unnecessary will-change |
| Blurry/slow blur effects | filter: blur() on large elements without compositing | Add will-change: filter or use backdrop-filter (composited) |
| Paint on every frame during animation | Animating color, background, box-shadow | If possible, use opacity transitions or pre-render states |
| Painting off-screen content | overflow: visible preventing culling | Add contain: paint or overflow: hidden to clip boundaries |
| Slow initial paint on long pages | Too many elements painted at once | Use content-visibility: auto to defer off-screen rendering |
5. Composite
This is the magic step. The compositor takes all the painted layers (now just GPU textures) and figures out how to stack and transform them into the final frame. It applies transform, opacity, and filter by manipulating textures on the GPU, no main thread involvement needed.
This is why transform and opacity animations are fast: they only trigger Composite, skipping Style, Layout, and Paint entirely after the first frame.
What runs here
transform(translate, rotate, scale, skew, matrix)opacityfilter/backdrop-filter(when the element has its own layer)- Scrolling (in most cases, the compositor handles scroll offsets directly)
/* This animation ONLY hits the compositor after the first frame */
.card {
  will-change: transform;
  transition: transform 0.3s ease;
}
.card:hover {
  transform: scale(1.05) translateY(-4px);
}
What makes it slow
Too many layers. Each layer is a GPU texture. More layers = more memory and more compositing work:
10 layers = fine
100 layers = probably fine
1000+ layers = you'll notice, especially on mobile
Overlapping layers that trigger implicit promotion. If element A has its own layer and element B overlaps A visually but is painted above it, the browser might promote B to its own layer too (to preserve correct z-ordering). This is called implicit layer creation and it can cascade:
/* Element A: explicitly promoted */
.a { will-change: transform; z-index: 1; }

/* Elements B, C, D overlap A visually and are painted above it
   → browser might promote all of them implicitly */
.b, .c, .d { position: absolute; /* overlapping .a */ }
Fix: use z-index to keep promoted elements on top, so nothing needs to be implicitly promoted above them.
Non-composited animations. If you animate a property that the compositor can't handle, the browser falls back to the full pipeline on every frame:
/* Compositor-only, fast */
.good { transition: transform 0.3s, opacity 0.3s; }

/* Triggers Layout + Paint every frame, slow */
.bad { transition: width 0.3s, top 0.3s, box-shadow 0.3s; }
backdrop-filter re-sampling. This one is sneaky because it looks compositor-only but hides GPU-side cost. Elements with backdrop-filter get their own layer automatically (the browser needs to sample the pixels behind them). So animating transform on them is technically compositor-only, it skips Style, Layout, and Paint. But every frame the element moves, the GPU has to re-read and re-blur a new rectangular region of pixels underneath it. The transform is cheap; the re-sampling is not.
The cost scales with the area of the element × the blur radius. A small frosted chip sliding around is fine. A full-viewport backdrop-filter: blur(20px) panel animating its position will tank your frame rate.
/* Fine: small element, compositor handles it easily */
.tooltip {
  backdrop-filter: blur(12px);
  transition: transform 0.2s ease;
}

/* Expensive: large area means the GPU re-samples a huge region every frame */
.fullscreen-overlay {
  backdrop-filter: blur(20px);
  width: 100vw;
  height: 100vh;
  animation: slide-up 0.5s ease;
}
The re-sampling happens whenever the pixels behind the overlay change, whether you move the overlay itself or the content underneath it. The only way to avoid per-frame re-sampling is if both the overlay and everything behind it are fully static. In practice, the mitigation is to keep the element small and the blur radius low.
Pain point summary
| Symptom | Cause | Fix |
|---|---|---|
| Smooth animations on desktop, janky on mobile | Too many composited layers eating GPU memory | Reduce layer count, audit in Layers panel |
| Unexpected layers in DevTools | Implicit layer promotion from overlap | Use z-index to keep promoted elements on top |
| Animation still janky despite using transforms | Element not promoted to its own layer | Add will-change: transform (only on the animating element) |
backdrop-filter element janky when animating transform | GPU re-sampling blur region every frame | Reduce element size and blur radius |
| Scroll jank | Main-thread scroll handlers preventing compositor scroll | Use passive: true on scroll/touch listeners, or CSS scroll-timeline |
Putting it all together
Here's the full picture of what each property change triggers:
| Change | Style | Layout | Paint | Composite |
|---|---|---|---|---|
transform | - | - | - | Yes |
opacity | - | - | - | Yes |
filter (composited layer) | - | - | - | Yes |
color, background-color | Yes | - | Yes | Yes |
box-shadow, border-radius | Yes | - | Yes | Yes |
width, height, padding, margin | Yes | Yes | Yes | Yes |
top, left, right, bottom | Yes | Yes | Yes | Yes |
font-size, text-align | Yes | Yes | Yes | Yes |
display, position, float | Yes | Yes | Yes | Yes |
The fewer steps triggered, the cheaper the change.
The mental model
There's no golden rule. "Just use transform and opacity" is good advice for animations, but it doesn't cover the full picture, you'll still hit backdrop-filter re-sampling costs, layer explosions, wide style invalidations, or layout thrashing from a read/write loop buried three files deep.
Optimization here is not about memorizing a checklist. It's about understanding what each step costs, what triggers it, and what helps the browser skip it. Every CSS property you touch, every DOM mutation, every layout read has a cost that propagates through one or more of these stages. The job is to be conservative about what you do and keep the downstream impact in mind:
- Before adding a
will-change, ask if the element actually animates, or if you're just burning GPU memory for nothing. - Before toggling a class on
body, ask how many elements that invalidates, or if you can scope it to a subtree. - Before animating
widthorheight, ask if atransform: scale()achieves the same visual result without triggering layout. - Before adding
backdrop-filter: blur()on a large moving element, ask if the GPU re-sampling cost per frame is worth it on your target devices. - Before rendering 2000 DOM nodes, ask if
content-visibility: autoor virtualization can cut the work to what's actually visible.
None of these are rules. They're trade-offs. Sometimes you need to animate height because scale distorts content. Sometimes you need backdrop-filter on a large panel because the design calls for it. The point is to make those decisions knowing what you're paying for, not to discover it later in a DevTools flame chart.