Performance Monitor
Chrome DevTools' real-time Performance monitor panel for catching memory leaks, layout thrashing, and jank as it happens.
The tab nobody opens
Chrome DevTools has a real-time performance dashboard that most developers never touch. It's called the Performance monitor, and it gives you a live view of what your page is doing right now, not a recorded trace, not a Lighthouse report, just live numbers updating every frame.
How to enable it
- Open Chrome DevTools (
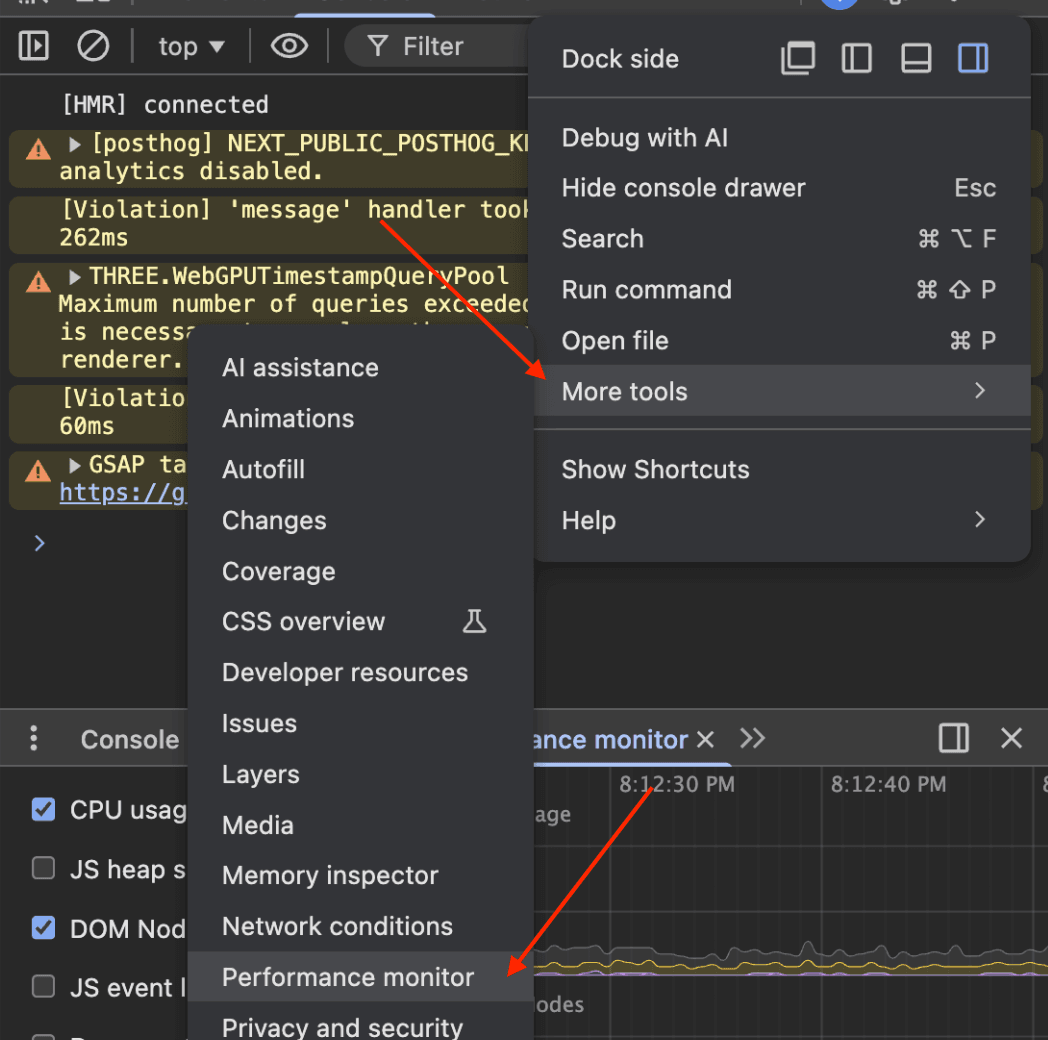
Cmd+Option+I/Ctrl+Shift+I) - Click the three-dot menu (⋮) in the top-right corner of DevTools
- Go to More tools → Performance monitor
A new panel appears at the bottom of DevTools with real-time graphs.
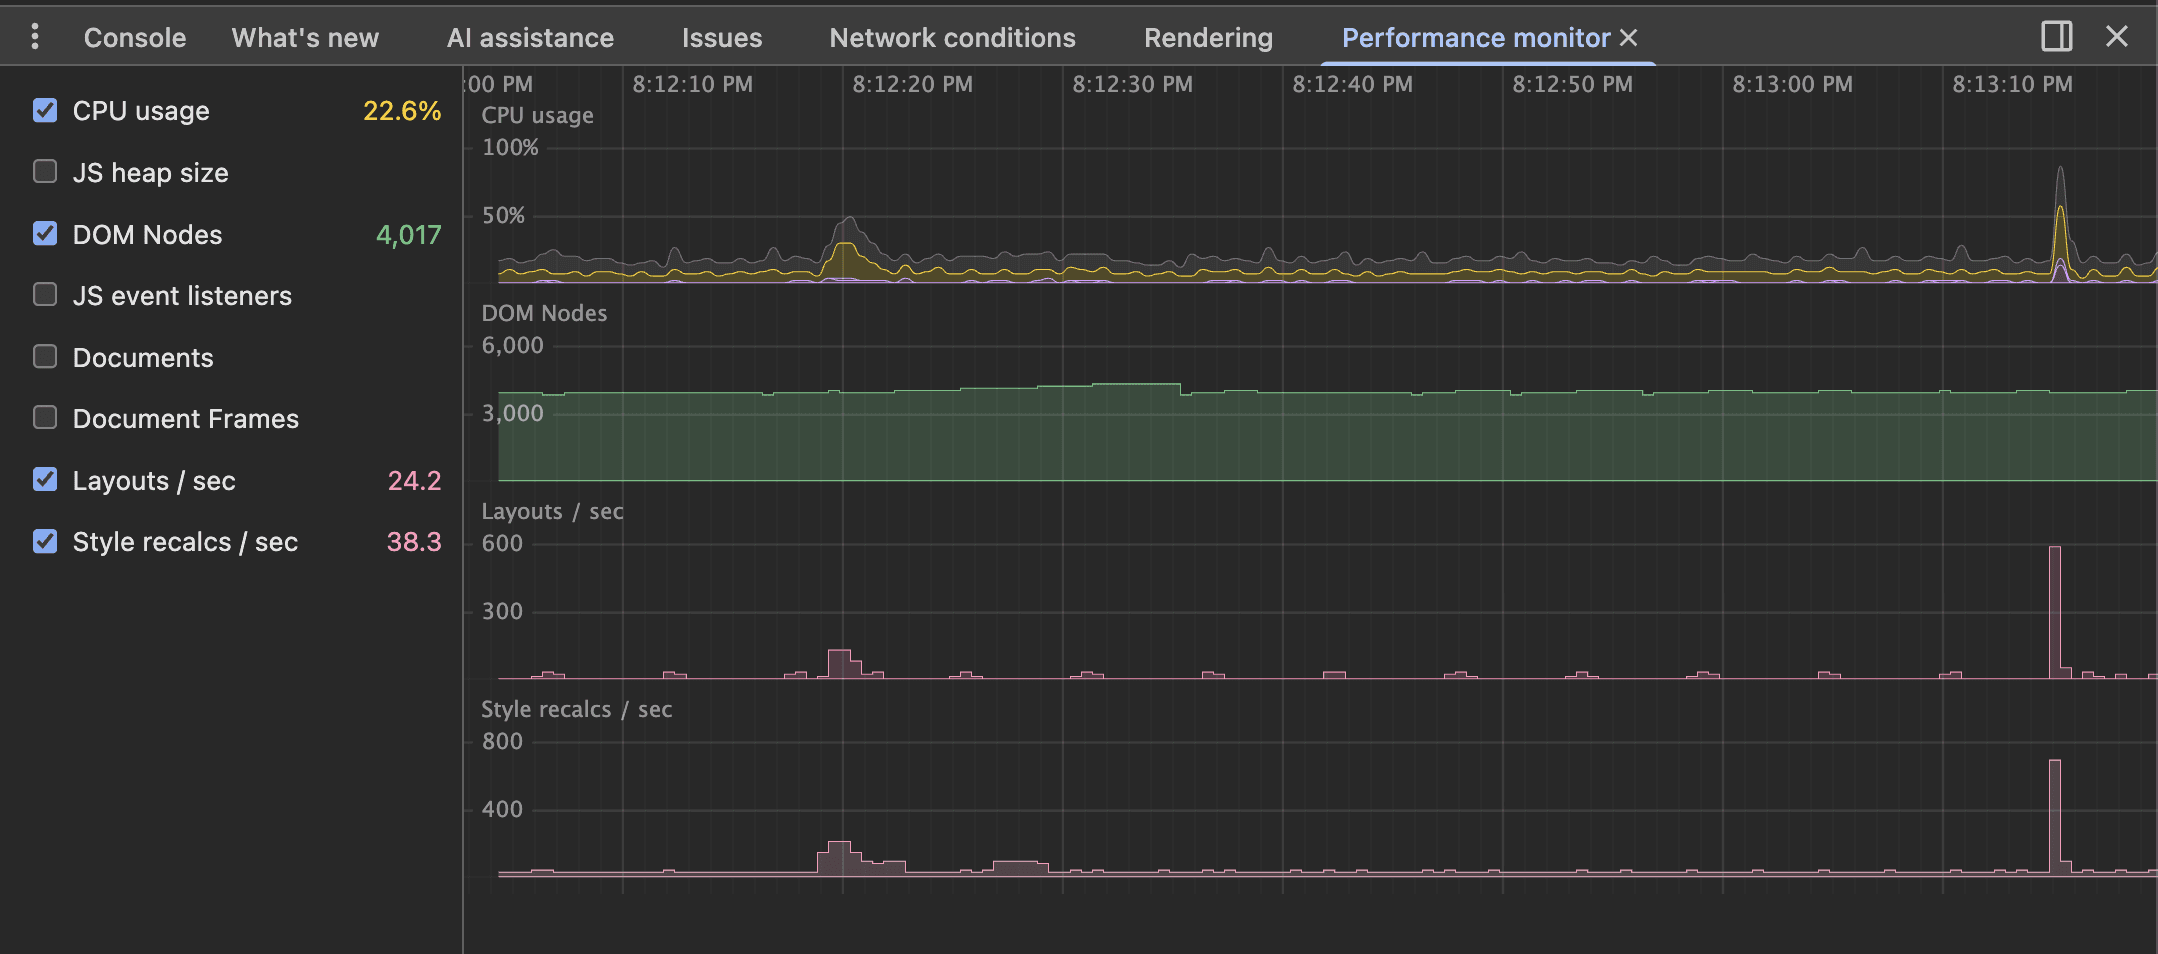
What it shows
The Performance monitor tracks these metrics in real time:
| Metric | What it tells you |
|---|---|
| CPU usage | Overall CPU load from the page. Spikes here mean something expensive is running. |
| JS heap size | How much memory your JavaScript objects are consuming. Steadily climbing = memory leak. |
| DOM Nodes | Total number of DOM nodes. If this keeps growing as you navigate, you're leaking DOM elements. |
| JS event listeners | Total registered event listeners. Growing count usually means listeners aren't being cleaned up. |
| Documents | Number of documents (iframes, etc.). Unexpected counts can indicate iframe leaks. |
| Document Frames | Sub-frame count. |
| Layouts / sec | How many layout recalculations the browser is doing per second. High numbers = layout thrashing. |
| Style recalcs / sec | How many style recalculations per second. High values often mean expensive CSS selectors or frequent class changes. |
When to use it
Debugging memory leaks. Open the monitor, navigate around your app, and watch the JS heap size and DOM Nodes. If either keeps climbing without coming back down, you have a leak. This is faster than taking heap snapshots because you can see the trend in real time.
Catching layout thrashing. If your page feels sluggish during scroll or animation, check Layouts/sec. Healthy pages do 0-1 layouts per frame. If you're seeing dozens, something is reading layout properties and then writing to the DOM in a loop, forcing the browser to recalculate layout repeatedly.
Monitoring event listener cleanup. In React apps with useEffect, it's common to forget cleanup functions. Watch the JS event listeners count as you mount and unmount components. If it only goes up, listeners are leaking.
Quick sanity check during development. Keep it open while you work. It's the equivalent of htop for your web page. You'll catch performance regressions the moment they happen instead of discovering them in a Lighthouse audit later.